Car_Sales_Dashboard
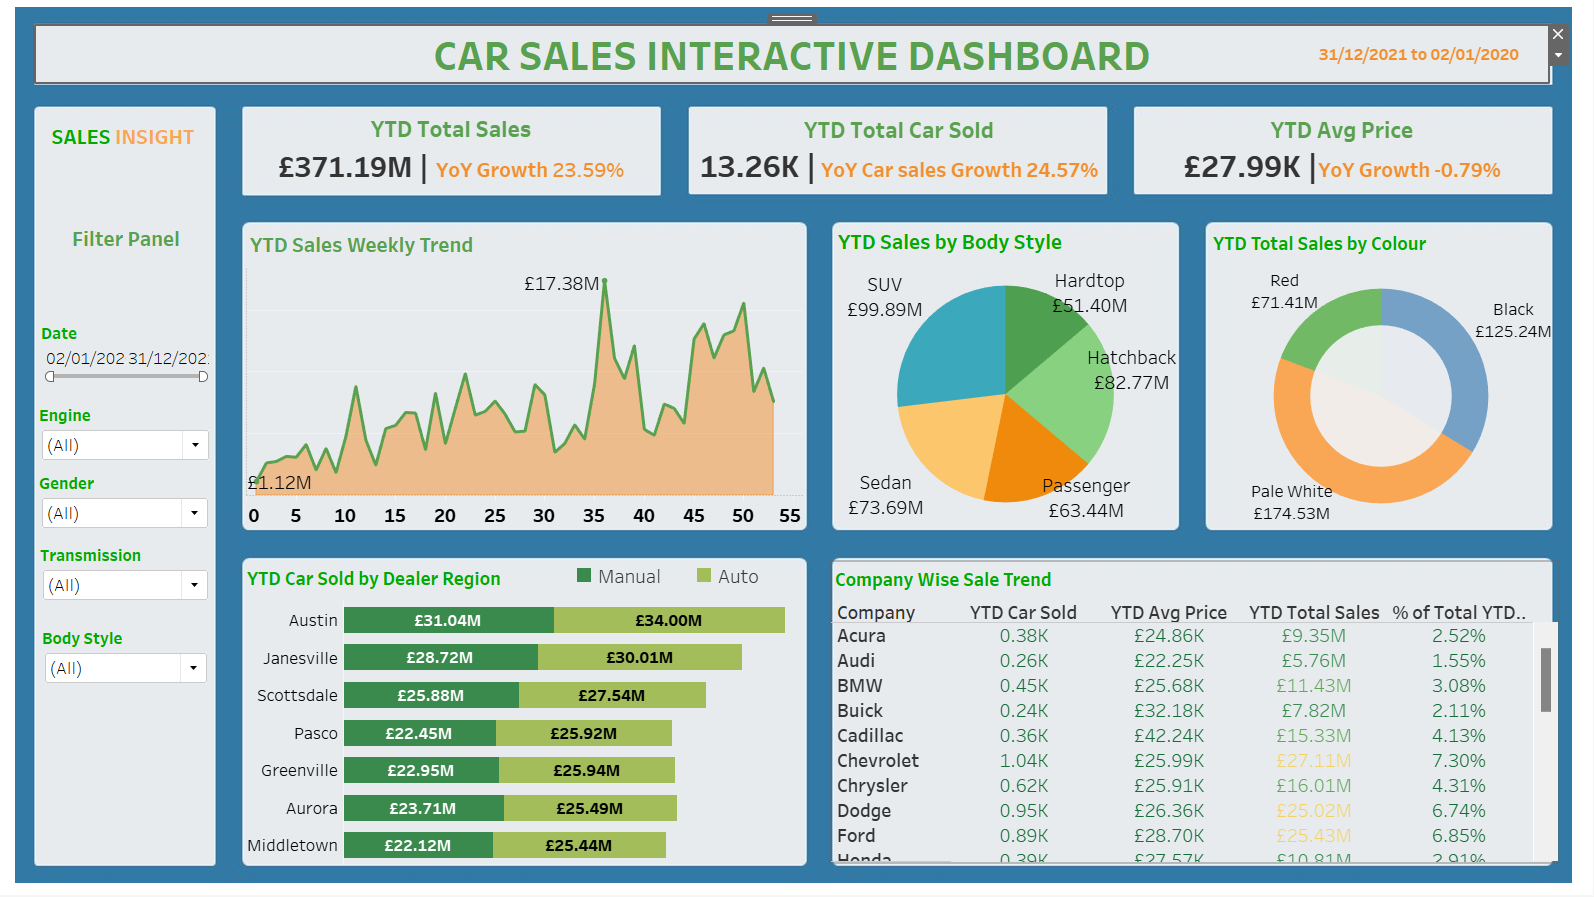
Car Sales Interactive Dashboard
Introduction
This is Tableau project analyzes car sales data. In order to help the stakeholder make data-driven decisions, the project will analyze and extract real time insights to address important questions, monitor progress and identify trends opportunities for growth.
Disclaimer: All datasets and reports are fictitious and are intended only to show off Tableau’s capabilities. They do not represent any organization or enterprise.
Problem Statement
- Sales overview?
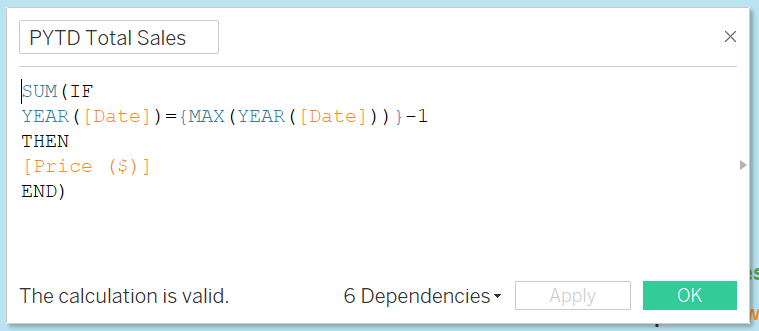
- Year to Year (YTD) Total Sales
- Year over Year (YOY) Growth in Total Sales
- Average Price Analysis:
- YTD Average Price
- YOY Growth in Average Price
- Cars Sold Metrics
- Year To Date Cars Sold
- Year On Year Growth in Cars Sold
- YTD Sales weekly trend
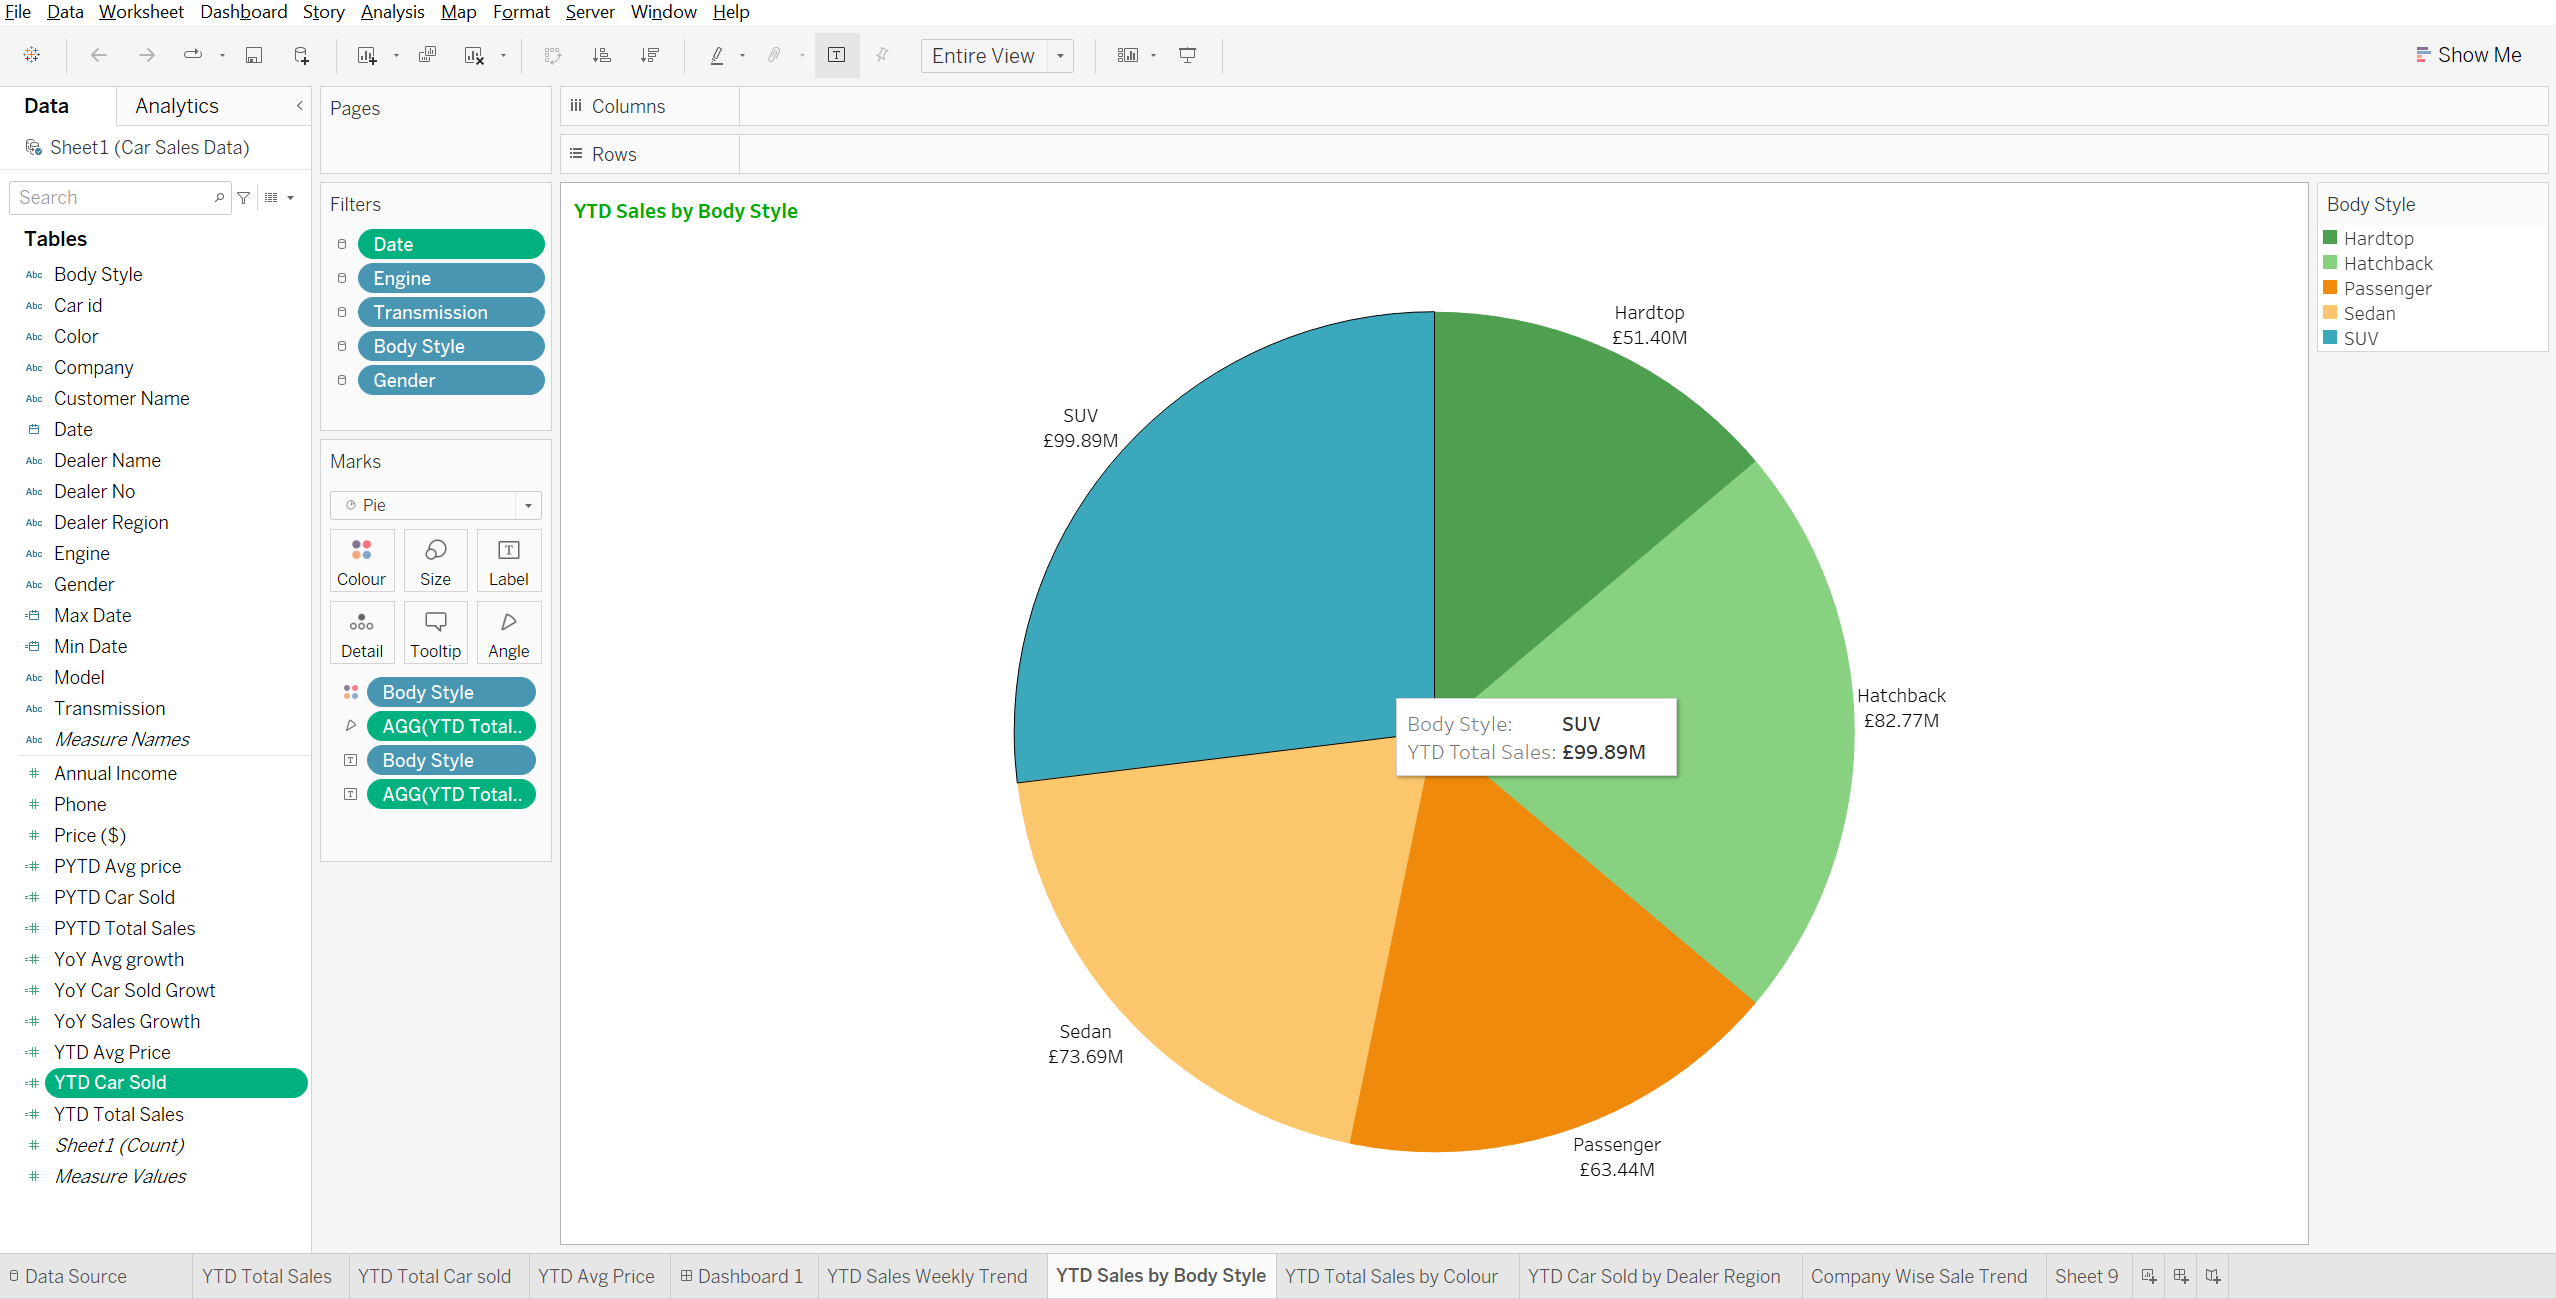
- YTD total sales by body type
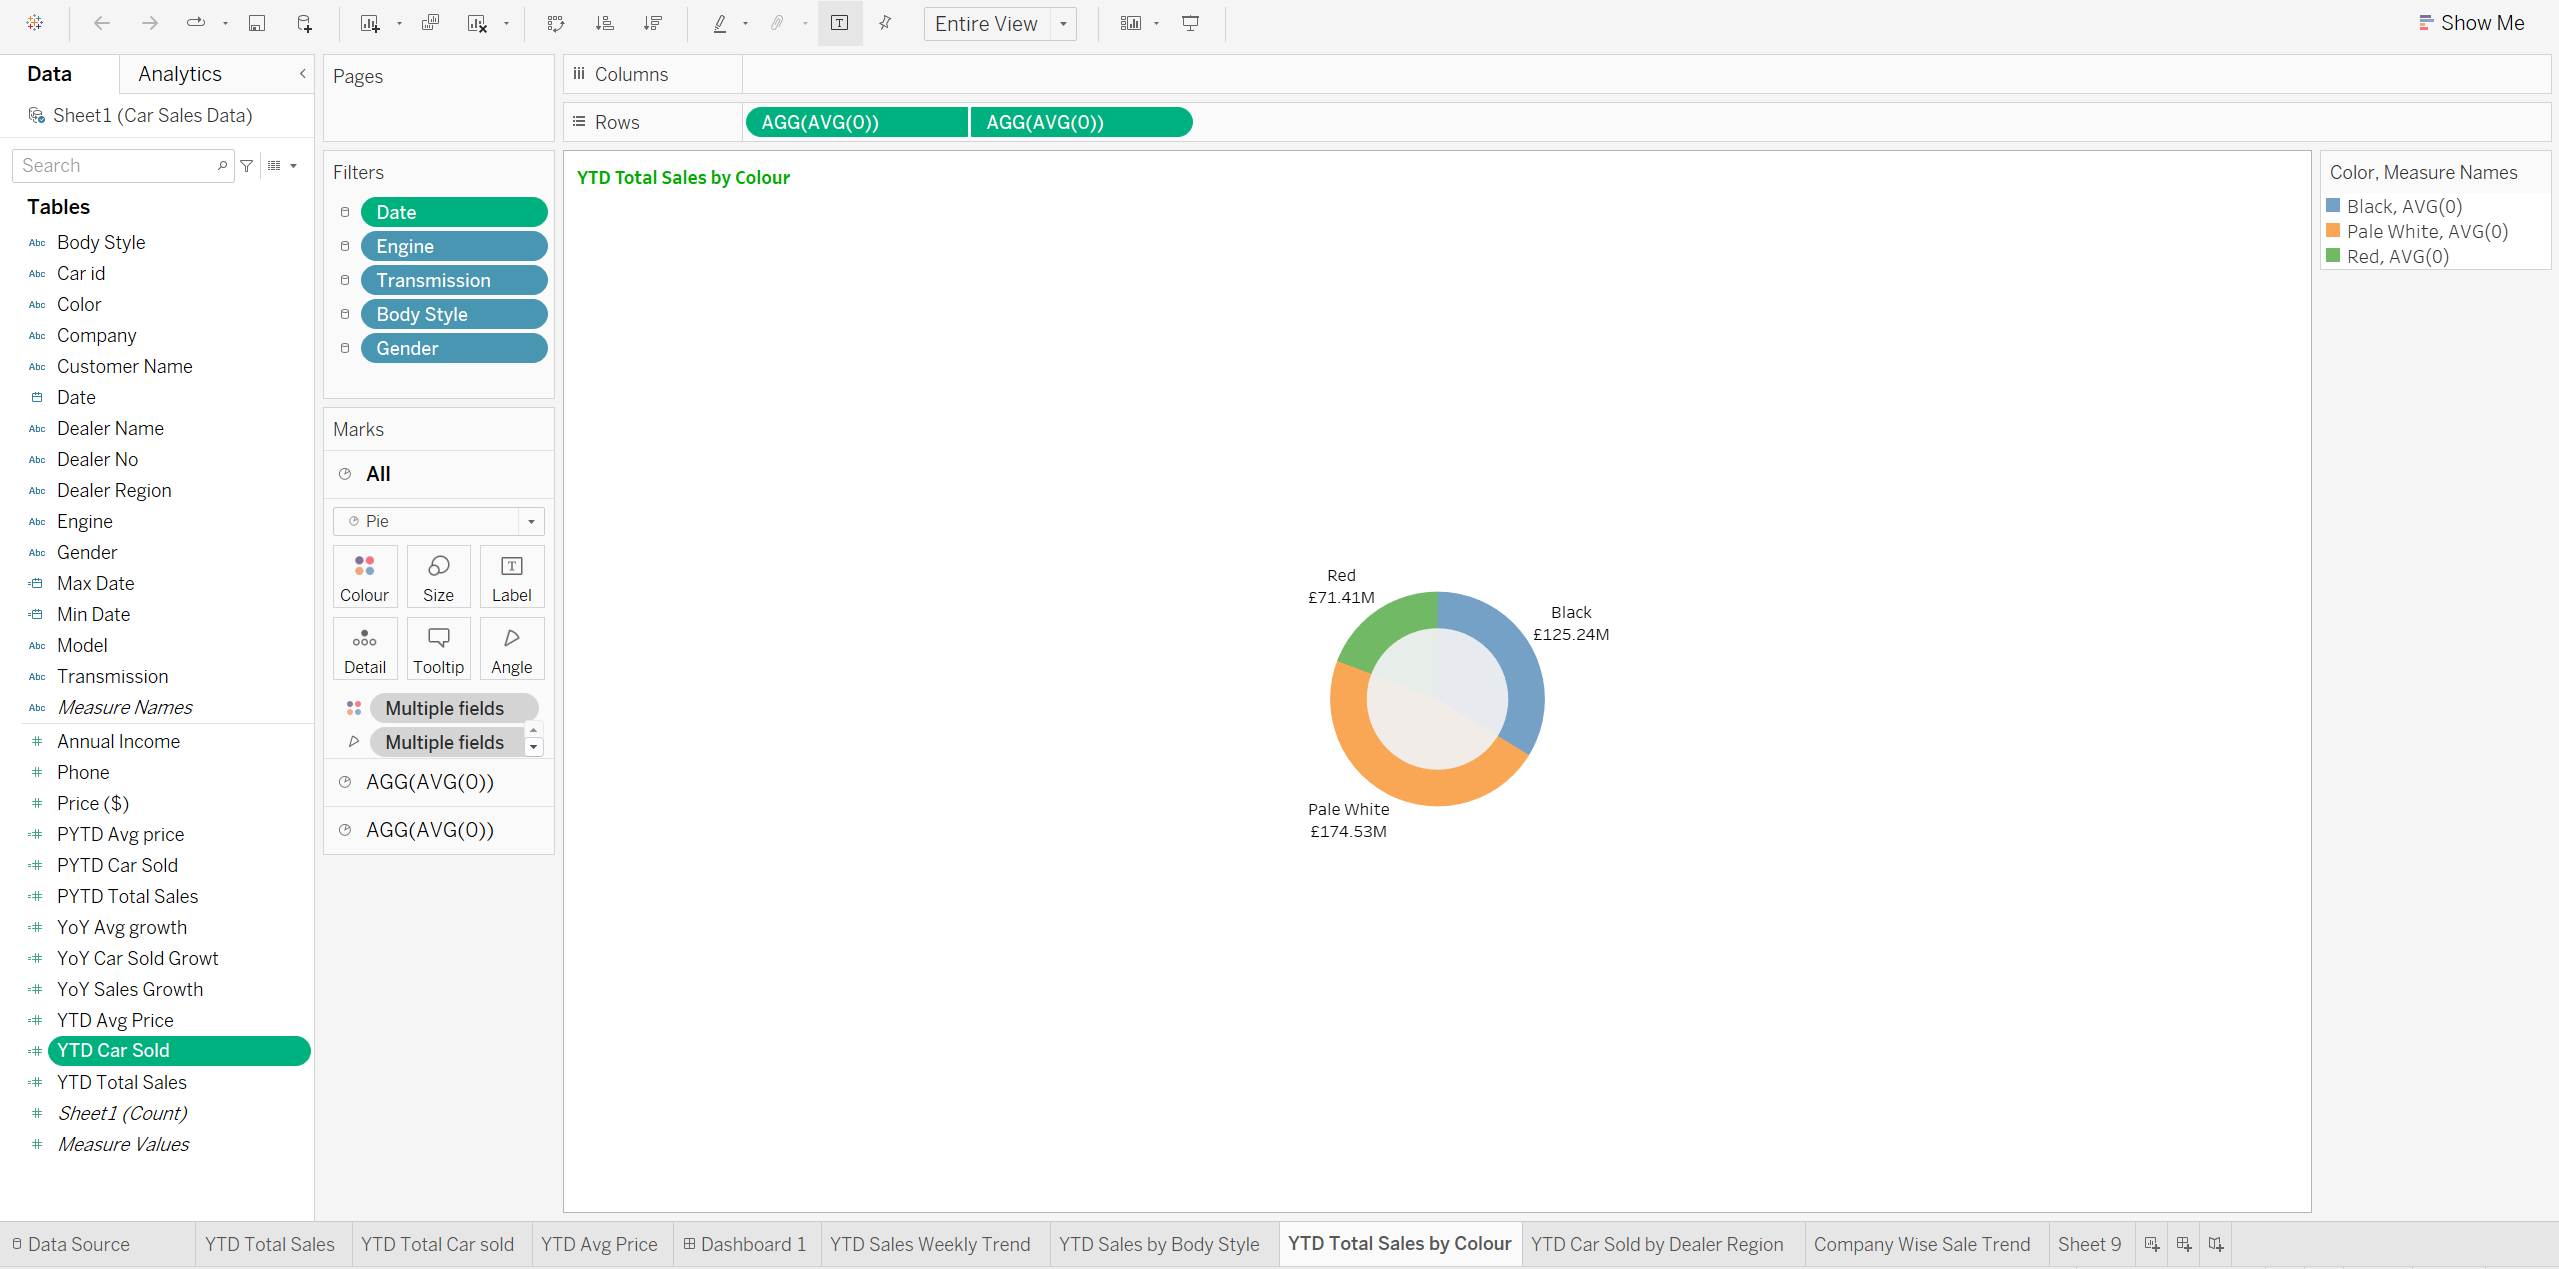
- YTD total sales by colour
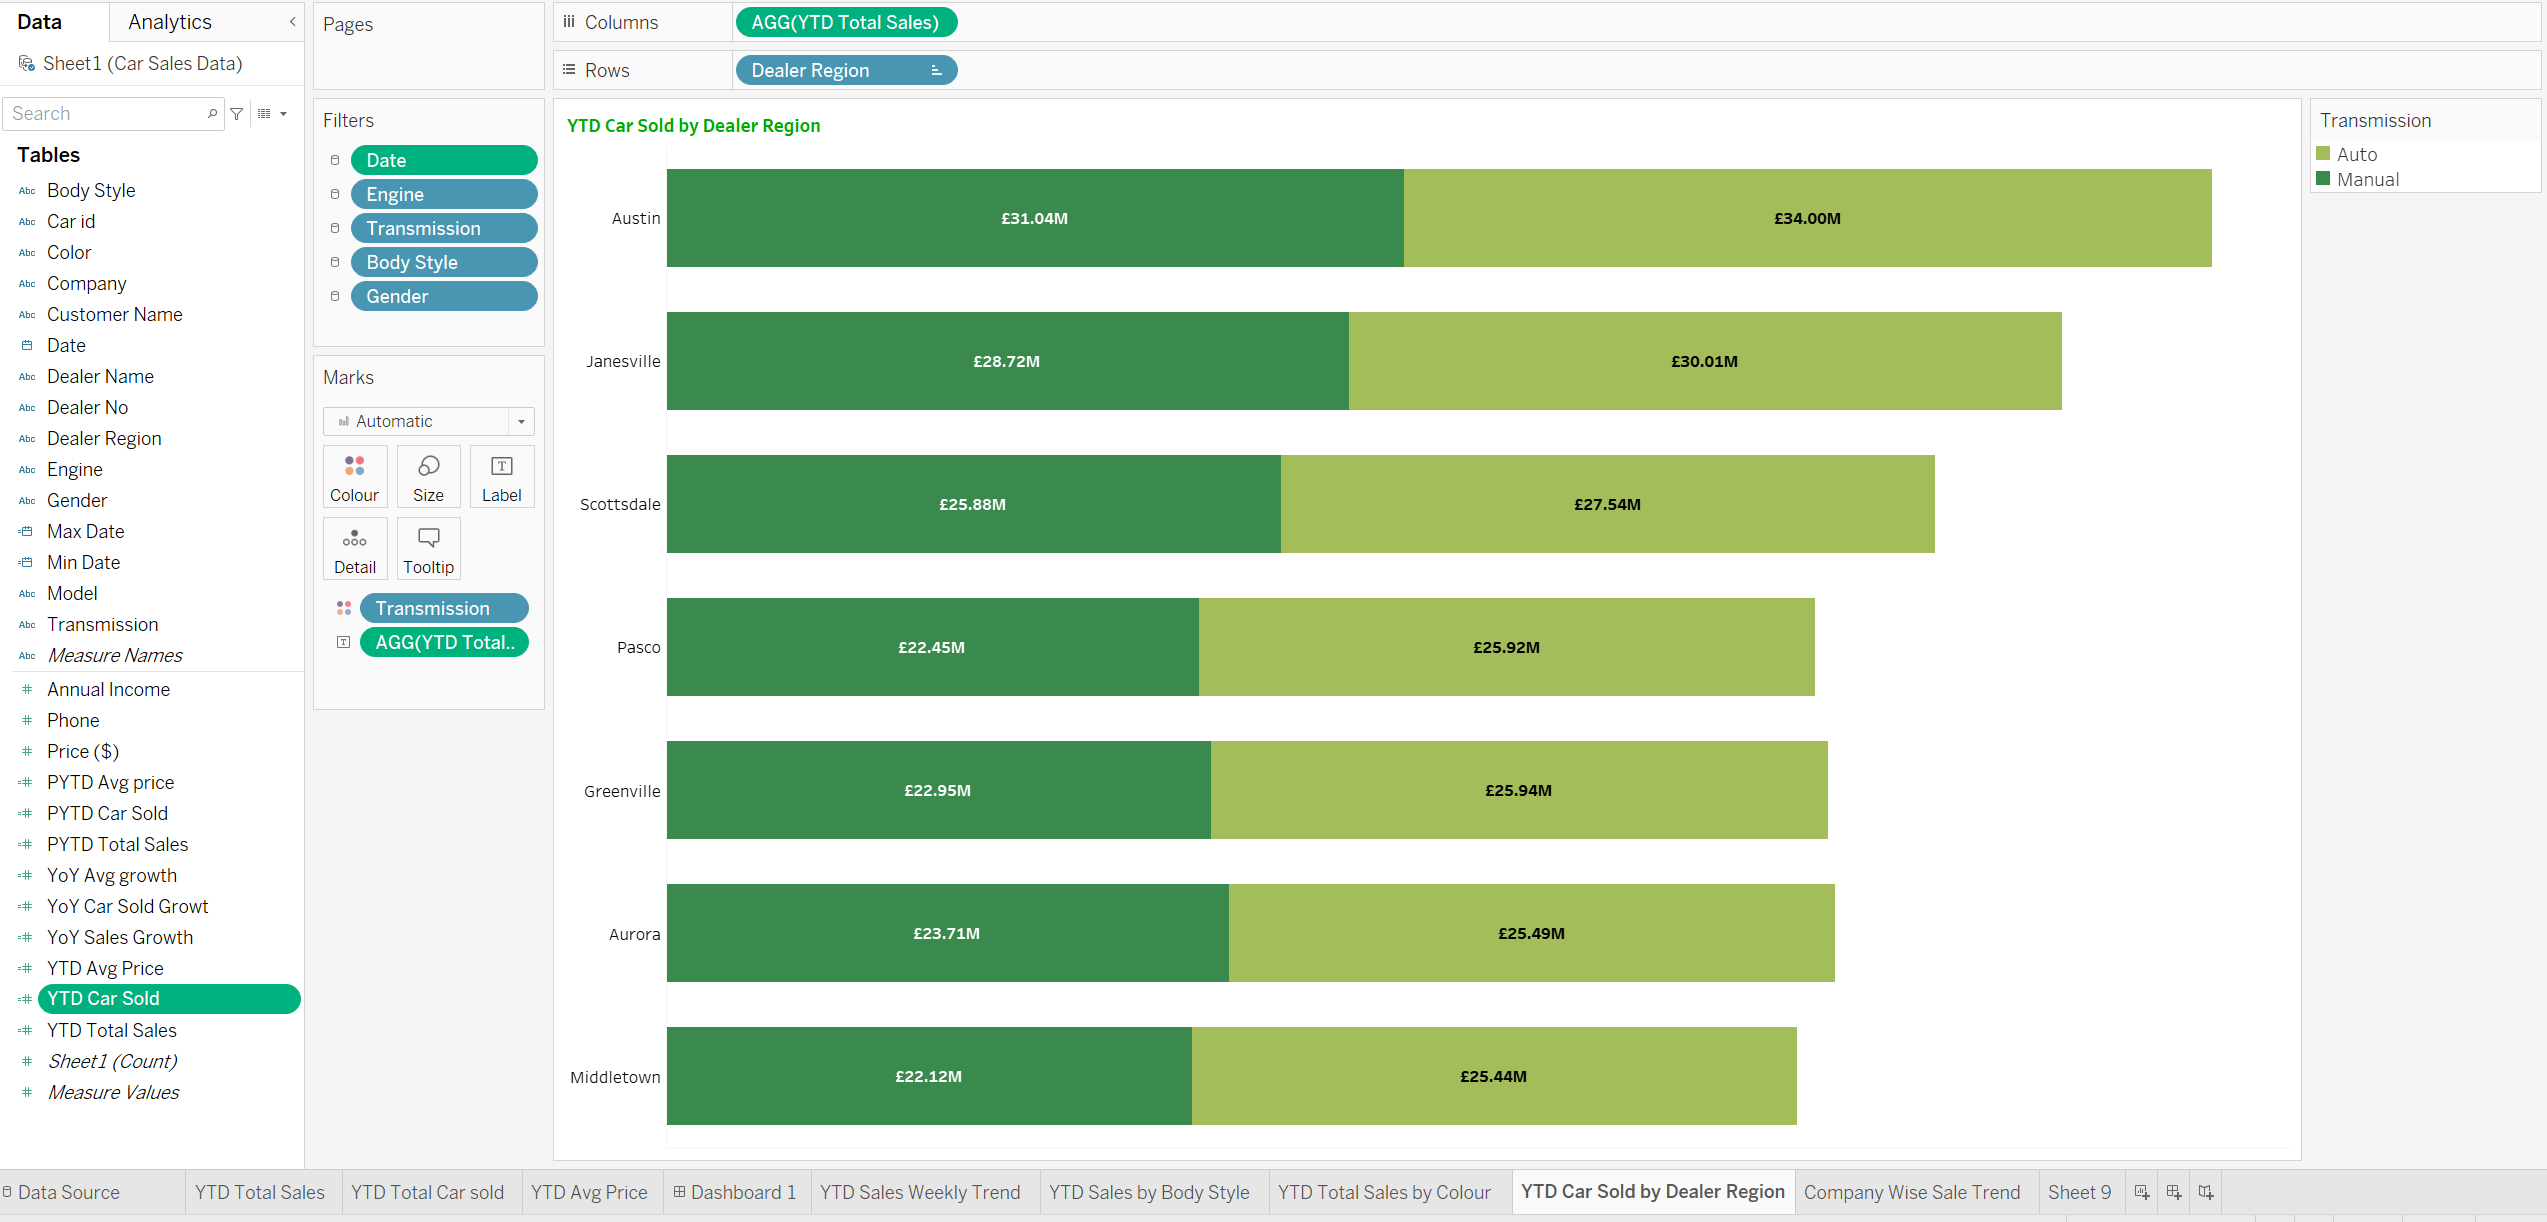
- YTD Car sold by dealer region
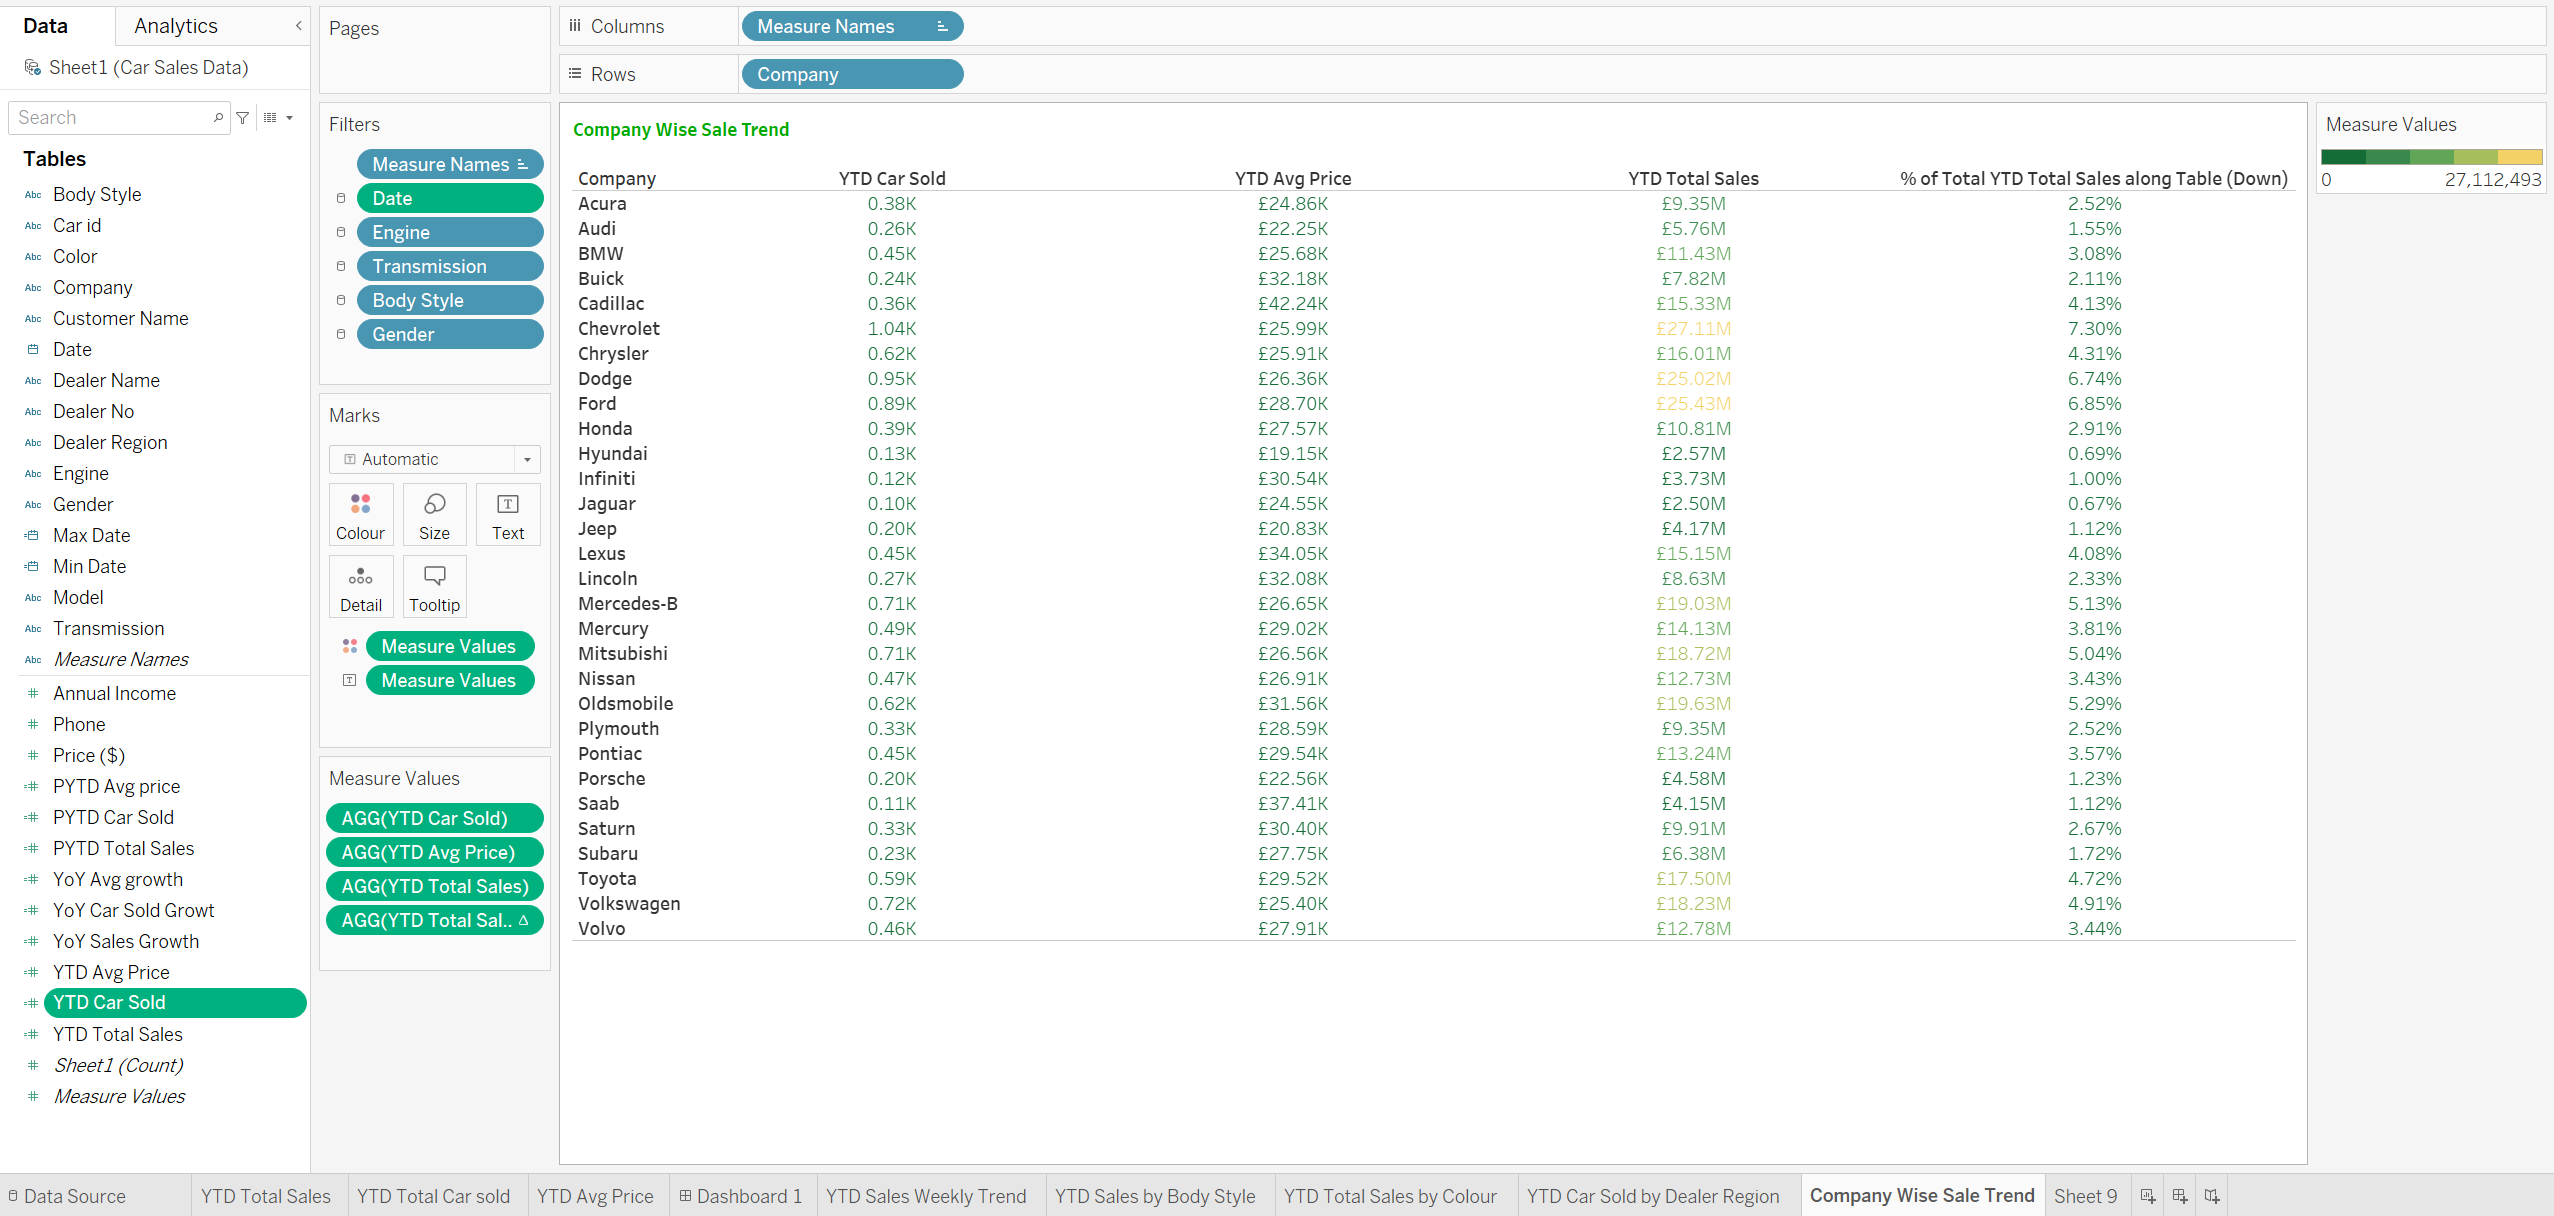
- Company-wise sales trend in Grid form
Skills demonstrated
• Tableau Visualisation
• Tableau Calculations
• Power point
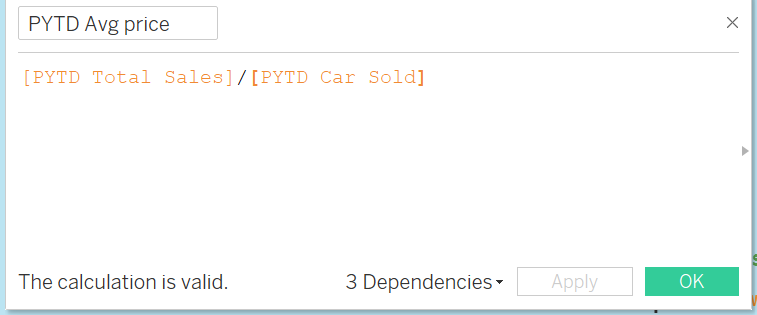
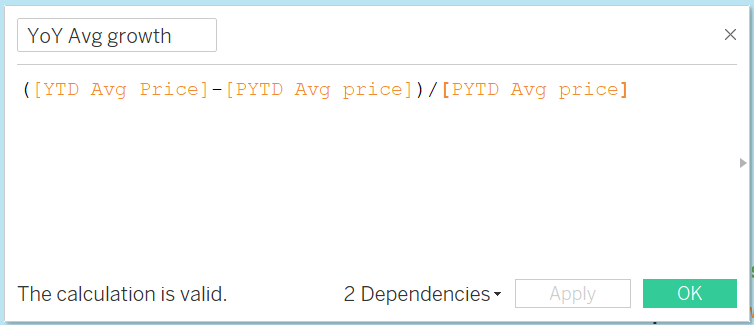
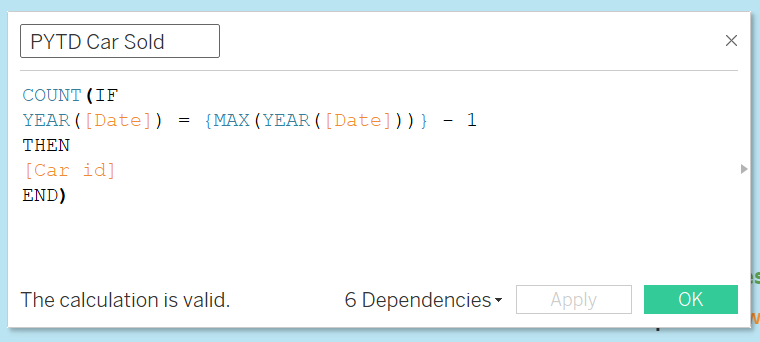
Calculations below were created to detailed analysis
| PYTD AVG PRICE | YOY AVG GROWTH |
|---|---|
 |
 |
PYTD CAR SOLD | PYTD TOTAL SALES
:——————-:|:———————:
 |
| —
—
Data Sourcing
This dataset was generated online and saved as a CSV file. To do insightful analysis, one must be aware of the dataset’s structure.
Visualization:
The report comprise of one page
- Car Sales Interactive Dashboard You can interact with the report here
| PYTD CAR SOLD | PYTD TOTAL SALES |
|---|---|
 |
 |
| PYTD CAR SOLD | PYTD TOTAL SALES |
|---|---|
 |
 |